This post was most recently updated on August 17th, 2022
As of now, the Abusive render report categorizes each refresh under one of three categories:
Misconfiguration: This happens when the ad unit is refreshed as soon as it is loaded (instantaneous), usually because of setup issues, loading multiple scripts, etc.
Bad Refresh: Refreshes that are not instantaneous like a misconfiguration but still happening in less than 25-second intervals.
Normal Refresh: Any refresh with at least 25-second intervals or more.
Checking for Bad Refresh
Bad Refresh happens when ads on a page are refreshed at less than 25-second intervals (but not instantaneously). The higher the number of bad refresh impressions, the easier it is to track them down. Follow the below steps to check or test for Bad Refresh for a given ad unit/domain.
- Go to the Abusive Render Duration report and select an ad-unit report with a high severity score.
- Select one of the top URLs from the list.
- Now append ?google_console=1 to the end of URL to open it with Google Publisher Console (Check this link, for more ways to open Google Publisher Console)
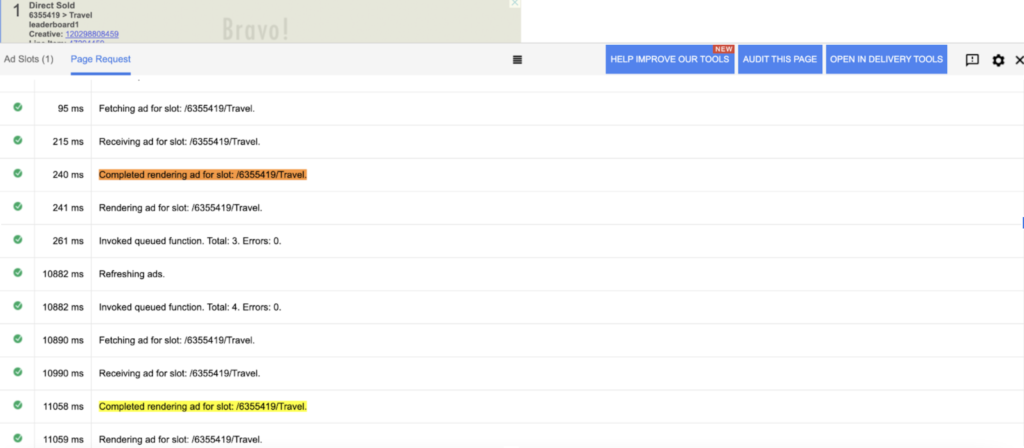
- Wait for a while and keep an eye on ad-refresh stats in Google publisher console > Page request > Timeline Section (for a given ad-unit name)
- Whenever a refresh happens, the stats will be updated and you will see a message saying “Completed rendering ad for slot: <slot-name>”
- Now you can calculate the total time difference using the timestamp given in the Timeline section. (Check the example below)
DEMO TEST PAGE EXAMPLE
https://s3.us-east-1.amazonaws.com/f.m2.ai/test-refresh.html?google_console=1
- Open the above URL and go to the Page request section in Google Publisher Console
- Wait for the ad to refresh
- Search for this message – Completed rendering ad for slot: <slot-name>
- In our example slot-name is: /6355419/Travel
- Now calculate the time difference between each event using the timestamp given in the Timeline.

In our snapshot time difference between the two refreshes is:
11058 – 240 = 10818ms (~10 seconds)
How to fix:
Once we are able to locate the page/URL where bad refresh and/or misconfiguration is happening, we should check for the code which is causing this refresh (third party app, on-page code) and remove it from the page.
Note:
- Usually, a severity score above ~30-40% is considered bad and such cases can be easily replicated.
- Bad Refresh scores of less than 10-20% may be hard to replicate, users may need several attempts to be able to replicate the instance.
- Scores lower than 5-10% shouldn’t be a cause for concern and may be ignored but continue to monitor from time to time.
- There can be cases where publishers stop doing (and/or fix) bad refresh/misconfiguration.