Ad network performance relates to the ad revenue a publisher earns through a specific ad network. Metrics to monitor include your RPM, comparing it impressions served as well your total ad revenue earned.
When comparing your ad network’s performance to another, publishers can determine whether the particular ad network is underperforming, on par with others, or even performing better. Publishers can then limit or decrease their exposure to low-performing ad networks and increase exposure to those performing better. Alternatively, they can choose which ad networks to focus their ad optimization efforts on to improve results.
How can you compare ad network performance and via different metrics? It’s possible via various reports in Google Ad Manager or even with manual reporting, but that could take up a lot of time to set up. Also, it can be a complex process for less experienced publishers, and any mistakes made could skew the results.
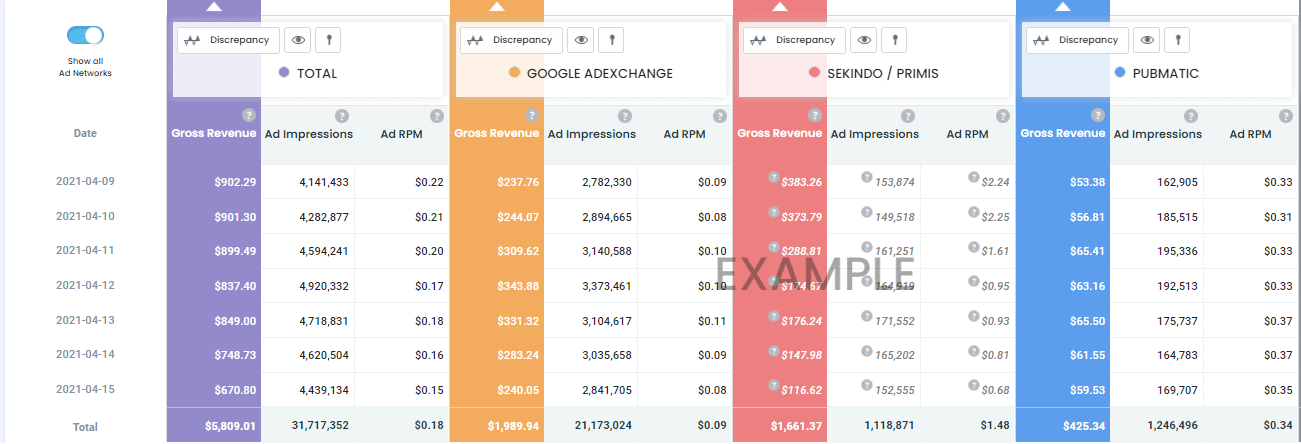
With PubGuru, MonetizeMore’s ad optimization platform, publishers get access to a unified dashboard where they can see ad network performance and compare results across the board. It’s called the Ad Network Report. Once set up, publishers need to log into the dashboard, and in seconds, they’ll have all the data they need to analyze ad network performance.
Here’s an example of the Ad Network Report:

The report enables publishers to do the following:
Find out more about PubGuru here.
Keep in mind that ad revenue and performance from ad networks can and will fluctuate. There are seasonality factors at play. For example, Q4 usually attracts many advertising dollars and competition between advertisers since it’s the end of the year and includes holiday events such as Black Friday and Christmas.
This generally leads to better ad performance across the board. The following year in Q1, things might look a lot different. Ad budgets are generally the lowest during these months (January, February, March) compared to Q4, which leads to low performance.
Be sure to read our ad revenue seasonality guide and try out some of our ad optimization tips before making any drastic ad network decisions.
When faced with low-performing ad networks, it could also be that the ad network does not do well with your audience and has a general low-paying advertiser pool. It might also be a sign that you need to test different ad unit types, ad layouts, ad optimization techniques, or even consider adding header bidding to the mix if you haven’t done so already.
What about the geography of your users? If most of them come from Europe, but the ad network focuses on US traffic, performance will be low. In such a case, it would be better to test an ad network that focuses on the traffic-geo related to your audience.
Be sure to check out this article where we show you how to optimize your ads, especially if your site has been growing in traffic: https://www.monetizemore.com/blog/ad-optimization-strategies-reach-1-million-pageviews/.
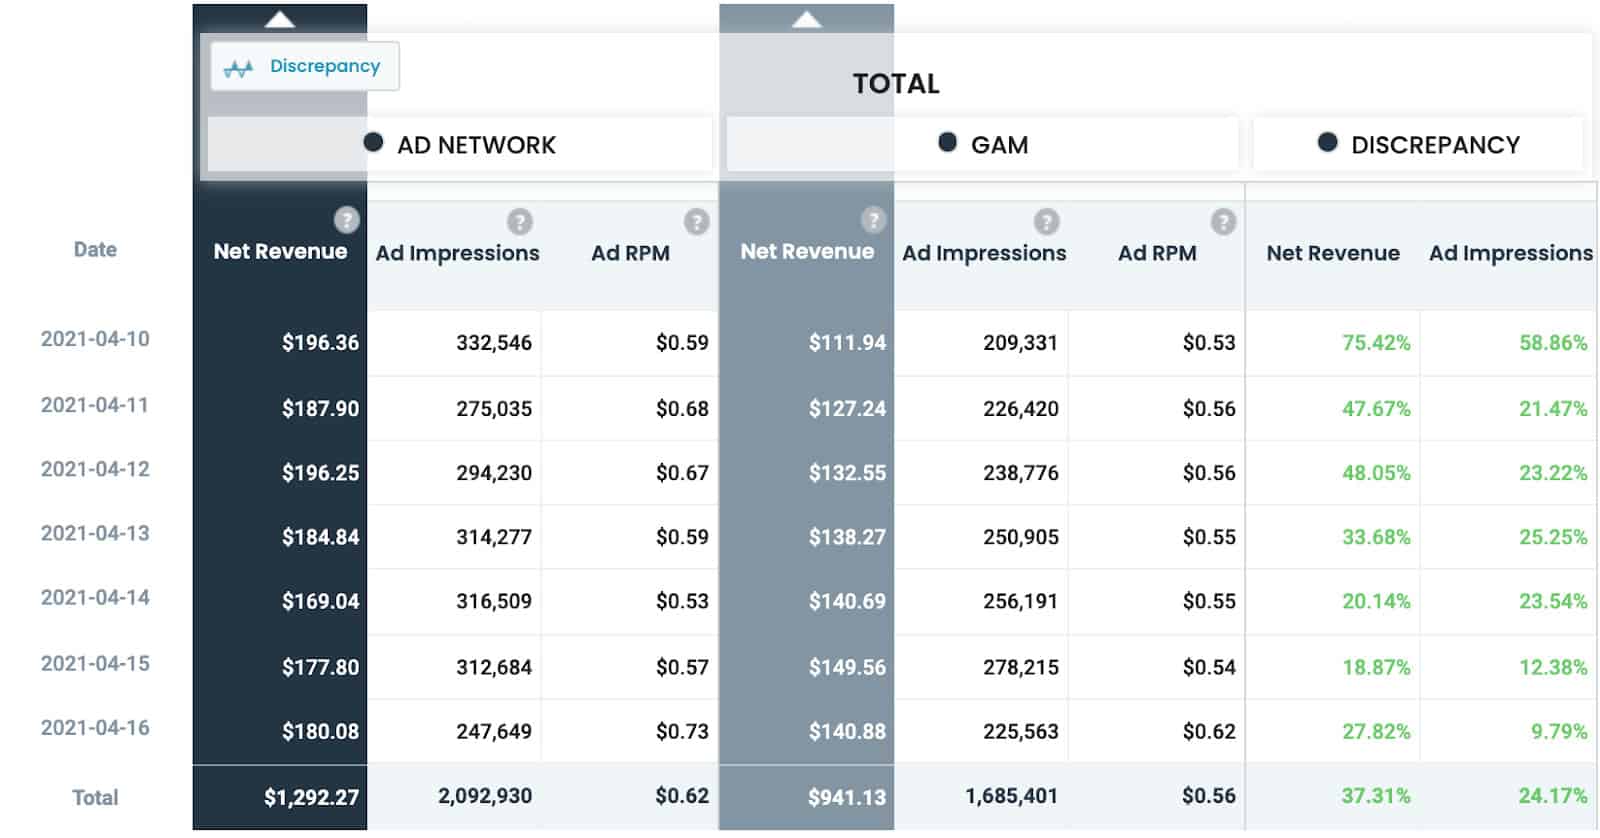
Clicking on the ‘Discrepancy’ button for each Ad Network will open up the discrepancy page that looks like this:

The discrepancy is calculated as =(Ad Network data / GAM data) x 100. Green means the Ad Network Report is higher than Google Ad Manager and red if the data is higher than the ad network’s data. Use this as a guide when optimizing the line items competing in your inventory. For example, if the Ad RPM under Google Ad Manager shows $0.53, you would multiply it by the Net Revenue discrepancy (in this case 1.7542 because 75.42% in green means, the Ad Network Reports 75.42% above 100%).
It shows that this ad network is overscaled. It is set up in Google Ad Manager lower than what it actually pays which could hurt the competition. It’s also a lost opportunity especially if this is set as Price Priority wherein its priority in the auction depends on the line item CPM rate.
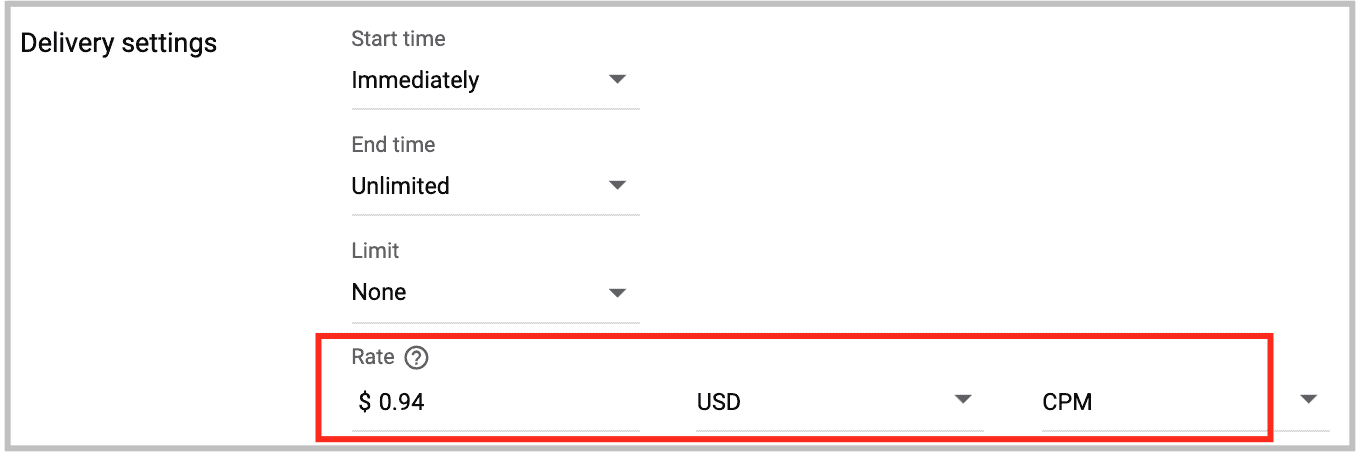
So in the above example, if you are using the 2021-04-10 report, you would calculate it as $0.53 x 1.7542 = $0.94. You then go to this ad network line item and set the CPM rate to $0.94.

Keep checking daily, use the most recent data and optimize accordingly to improve results.
Now that you’ve got a better understanding of ad network performance, it’s time for you to start analyzing results. If left unchecked, you could be running an ad from an ad network with low performance and be losing out on ad revenue as we speak.
For some, this can be a daunting task and take a lot of their time. Why not let MonetizeMore do it all for you instead? Our teams of ad optimization experts will analyze, optimize and improve ad network performance for each ad network and optimize your ad inventory across the board.
Are you ready to take your ad revenue to the next level? Sign up to MonetizeMore today!
10X your ad revenue with our award-winning solutions.