The reporting suite in Google Ad Manager (GAM), even in the free version, is very comprehensive, and there is a huge wealth of information to be gleaned about the performance of ad campaigns. In this article, we’re going to tackle one example of how to conceive, design, and create a report and schedule it to be repeated and sent to users by email using CPMs per country.
When it comes to querying any large database, you’ll find most are much the same. In most cases, you will be asking the database to pull out a subset of the records in that database, telling it which parts of those records you are interested in, and asking it to perform some sort of operation on the results.
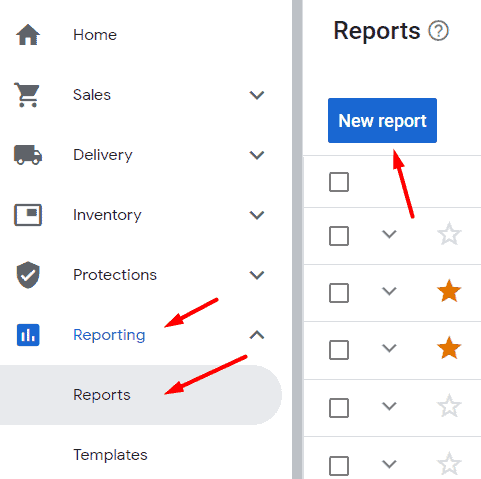
If you want to run a report in Google Ad Manager, go to Reporting -> Reports in the left menu, and then click ‘New report.’ This brings up the report builder.

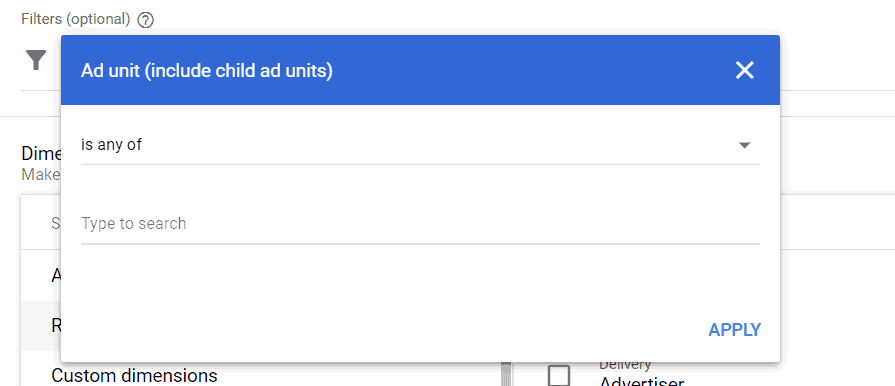
The first options help you narrow down your results. You can select the date range for the dates you’re interested in and then add filters. Filters narrow down the data and make the report more manageable. For example, you might want to run a report on a specific ad unit. You can select that ad unit in the filters box, and the report will only contain data pertaining to that ad unit.

The next section, dimensions, help you to set out how the report should look. If you select no dimensions at all, the report will show a grand total. Finally, the last section is metrics, which are the values you are looking for the report to calculate. The most commonly used metrics are the number of impressions, CPM, total revenue, and clicks.
If you selected your ad unit in the filter, no dimensions at all, and ‘total impressions’ as the metric, all the report would show is the total number of impressions served by that ad unit during your date range. If you added a dimension of ‘day’ to your report, the report would show the same total, but the report would also show a new line for every day and the total impressions for those days.
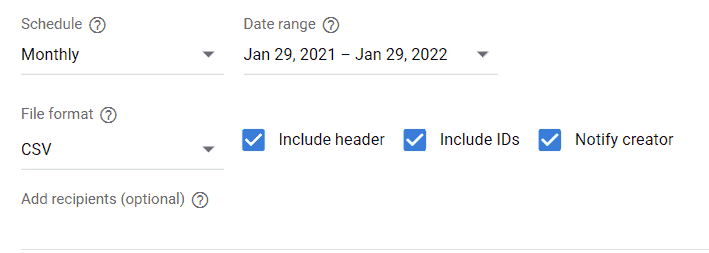
At the bottom of the report, the builder is the scheduler. Here you can tell Google Ad Manager to schedule a report to be run every day, week, or month, showing the updated information. You can select the type of file this should be sent to and who should receive it. One thing to remember here is that you should be using a dynamic or custom date range; if you use a fixed date range, the report will be the same every time, as the source data will not change.

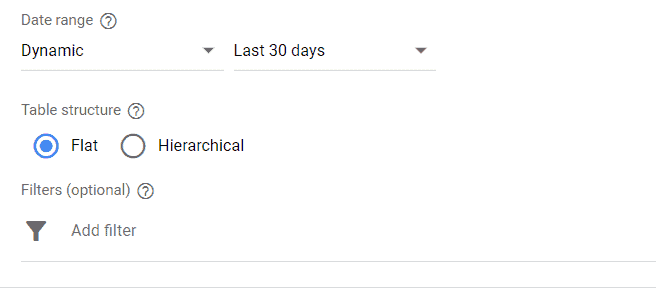
So, to our specific example for this exercise. First, we enter a name for the report and then select the date range. We’re going to request the data here for every day in the last month, so we’re going to select ‘Dynamic’ and ‘Last 30 days’ in the date range.
We will leave these blank for filters, as we want to show all countries in the report. We could select ‘country’ in the filter and then one or more countries if we wanted.

In the dimensions, we will select ‘Country’ and ‘Day’ as dimensions. This will show us the data by day for each country. It’s worth noting that this will decide the maximum number of rows in your report; if you have a report with a date range of 30 days and your ads are showing in 50 countries, then your report will have (30 x 50) = 1500 rows, one for each country and day combination possible (note though that lines will not show if they have no data to report).
Notice in the image below that I have typed ‘date’ in the search box in order to filter the dimensions to easily find the one I want.

Finally, select the metric required; in this case, we’re looking for average CPM, so we only need to select the ‘Total average eCPM’ metric (although you can select more if you wish).
At this point, it’s a good idea to click ‘RUN’ at the bottom of the report builder, which will show you what the report will look like. If it’s not quite right, you can go back and make changes. When you’re happy with the report, decide who should receive the report and in what format, and click ‘SAVE.’ The reports should start being sent to your recipients in the next reporting cycle, using a few hours after your reporting day has finished.
Google Ad Manager reports are versatile and a great way to take a deep dive into your ad inventory performance. Still not sure what the report is telling you and how you can optimize your ad inventory accordingly? Let MonetizeMore take care of that for you! We’re a Google Certified Publisher Partner for the North America region and have helped hundreds of publishers optimize their ad revenue. Let us do the same for you! Sign up today!
10X your ad revenue with our award-winning solutions.