
Sign up today and see the results for yourself!
Want to speed up your verification process?
Share a screenshot of your ad revenue from the past 3 months.
Could you be doing more to give your users a remarkable experience?
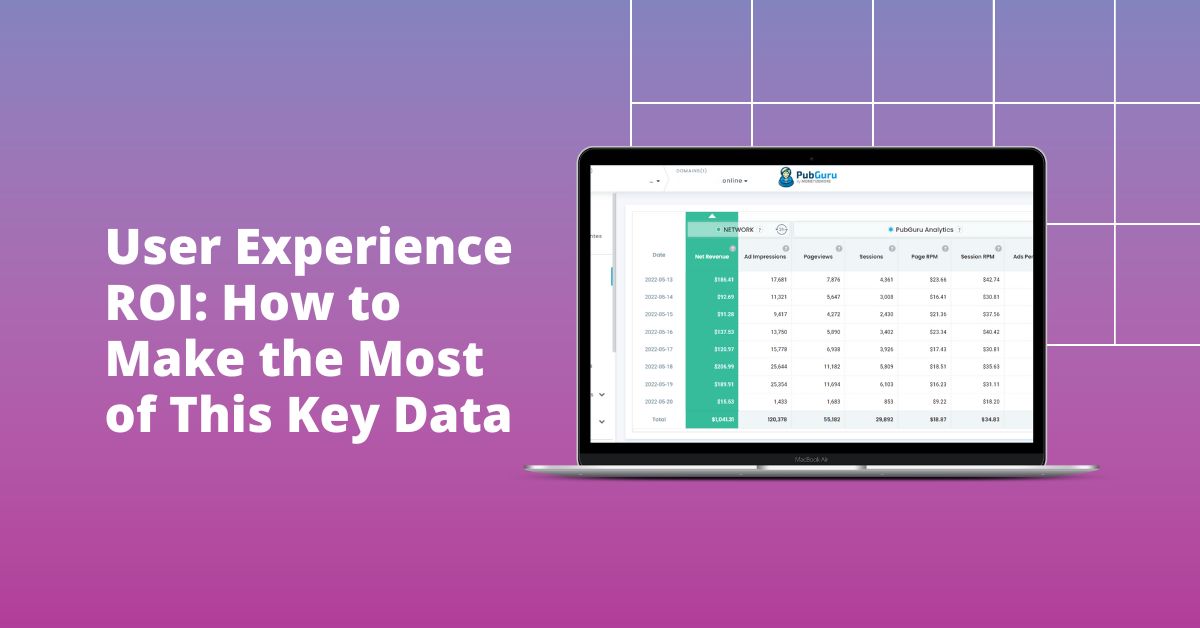
In this article, we’ll explore how to measure the returns you make on your investment into customer experience. We’ll look at a few common metrics and how best to apply them.
At a fundamental level, running a successful business is about maximizing income and minimizing costs. This reality informs every decision made about day-to-day operations.
That includes tangible investment decisions such as how many staff to hire and which of the available business telephone systems to equip them with. These costs can be quantified easily, and setting them off against known revenue figures leads to a simple ROI measurement.
While it’s rare for a business leader to openly say that customer experience isn’t important to them, sometimes it isn’t prioritized as highly as it should be. Often, this comes down to the fact that it’s easier to justify increasing the investment budget for a profit center like a sales department than a cost center like a customer service team.
Over time, this can lead to underfunding in customer experience, which can be detrimental to the business’s overall performance. That’s why putting a number to the concept by investigating user experience is crucial.
To put a figure on customer experience ROI means measuring it indirectly. This may seem like a daunting task. Nevertheless, there are a number of options available to explore how customers feel about interacting with you.
A useful approach is to look at these three areas:
Customer retention. Are customers staying with you? That’s usually a good sign that they’re satisfied with their experience. Conversely, you can look at churn as well to get a more rounded picture.
Upgrading stats. If customers are spending more with you now than before, you can attribute this to their trust in your service.
Recommendations. This is all about seeing satisfied customers as their own marketing channel. Word-of-mouth recommendation is of direct benefit to your organization, cutting through the ad clutter and helping you secure new business.
But what can you use to measure these?
Asking customers directly about their experience via a survey or other feedback method is good practice. Useful metrics you can glean from this process as a proxy for customer experience include:
This is one of the most commonly used metrics in modern marketing. The customer is asked to score you on a scale of zero to 10 depending on how likely they’d be to recommend your service to friends and family. You total the responses and subtract the percentage of detractors (people giving you a score of six or less) from the percentage of promoters (those giving a score of nine or 10) to arrive at your NPS.
The beauty of an NPS is it can be tracked easily over time. This means you have a solid perception of how happy your customers are and can measure how that changes.
To calculate your CSAT score, you first ask customers to rate how satisfied they were with your service, again on a numerical scale. The total number of positive responses as a percentage of the total number of overall responses is your CSAT score.

Although the information you gain by asking for customer feedback is useful, measuring customer engagement with Google Analytics is crucial too. That’s because it makes it much easier to tie the figures into various financial metrics. Some vital stats to look at include:
A session refers to the visit someone makes to a website, no matter how many pages they look at. It’s measured in terms of total time spent. The more engaged your customers are, the longer they’ll spend on your site.
Revenue per session (also known as session RPM) measures the average amount of revenue per site visit session. This is how you can begin to nail down customer engagement in terms of hard financial numbers.
It’s critical to keep an eye on the bounce rate too. Could your website be performing better? Bounce rates vary a lot depending on the device the customer is using to access your site and the sector your business operates in. You should benchmark this and watch how it performs over time.
It’s safe to say that if you offer a good ad experience to users on your website, the internet will be a much better place. Fewer users will feel inclined to install ad blockers, and more funding would be available for internet and publishing development. Luckily Google published a list on their DoubleClick blog from research conducted by the Coalition For Better Ads and identified ads that users hate. They go hand in hand with the Ad Experience Report Tool I mentioned above. It is great information to be aware of, especially if you are a serious publisher.
Interrupting ads: An example is visiting a news website, trying to read a recent post and being inclined to pause for a specific duration to view the ad before being able to see the page fully. This type of interference is labeled as the most irritating to users. This is especially evident on mobile devices in ad formats such as pop-ups that prevent users from reading the content without disruption.
See the example below:

Distracting ads: This includes ads with flashing imagery and auto-play sound clips. According to the research, users decide within a mere second if they will stay or exit your site. These types of distracting ads could increase users’ exit rates and is a risk on mobile and desktop devices.
See the example below.

Cluttering advertisements: Too many ads on a page could increase the page load time of your site. Google has stressed page load times many times before, so much that it has even become one of the many SEO ranking factors to look out for. Slower load times can decrease a user’s overall experience of a website. It can also get harder for users to find what they are looking for and the adverse effects just keep piling up.
According to research from Google, more than half of users are implementing ad blockers because of too many ads with the rest stating it’s because of annoying ads.
User’s seriousness about privacy: This group cares more for control than the experience they have on a site. Whitelisting a website would be a normal cause of action for them, disabling an ad blocker, not so much.
Users that hate ads: This group of users wants to have a web experience without ads. Blocking them from seeing content will probably not change their mind. They will only exit your website.
Unknown blocking users: Would you believe that some users have an ad blocker installed on their browser without knowing it? It’s more common than you think. An example would be where an acquaintance installed the blocker on their device. Luckily this group does not mind changing their ad blocker settings, whitelisting and removing it entirely. However, instructions on how to achieve these results need to be clear and easy.
Overwhelmed by ads users: This group is in support of ads and promoting the online content generation, but annoying ads are too much for them. They employ ad blockers since they believe there aren’t any other options available. You can try implementing paid subscriptions within this group as well as asking them to whitelist your website on their ad blocker.
Even if you get everything right – with a top-performing website, excellent product, and the best phone service, etc. – perfecting your users’ experience can still feel elusive. One vital thing to bear in mind is that how easy it is for a customer to switch between providers varies by industry.
This means that for each organization, there is an optimal level of customer experience. It’s possible not only to invest too little in it but also too much. You can get to a point where additional investment doesn’t lead to any meaningful increase in business performance.
Additionally, you should beware of metrics that make the underlying reality look good when it isn’t. For example, if you’re tracking customer experience via customer satisfaction metrics and you see an increasing trend, you may assume that’s great news. However, if customer churn has increased in parallel, it could mean the average customer satisfaction score has only gone up because lots of unhappy customers have left!
The take-home message is that you shouldn’t be using just one or two metrics when you’re trying to understand customer experience ROI. No single number or data point will tell you what you need to know on its own.
The best approach is to select several complementary stats that you track over time. That way, you’ll have a good idea of how your customers perceive their interactions with your business, which is exactly what you want. After all, keeping customers happy is great news for your bottom line.
If improving your user’s ad experience seems like an uphill battle, or you simply want to maximize your website’s earnings, contact MonetizeMore for a free consultation today!


John Allen – Director, SEO, 8×8
John Allen is a driven marketing professional with over 14 years of experience, and an extensive background in building and optimizing digital marketing programs across SEM, SEO, paid media, mobile, social, and email, with an eye to new customer acquisition and increasing revenue.

Kean Graham is the CEO and founder of MonetizeMore & a pioneer in the Adtech Industry. He is the resident expert in Ad Optimization, covering areas like Adsense Optimization,GAM Management, and third-party ad network partnerships. Kean believes in the supremacy of direct publisher deals and holistic optimization as keys to effective and consistent ad revenue increases.


10X your ad revenue with our award-winning solutions.